The FWAC Fire Growth Potential Model: Determining Wildfire Growth Likelihood
Tesmond D. Hurd 1*
1 Fire, Weather & Avalanche Center, Island City, Oregon 97850
Read full PDF version
*Corresponding author address: Tesmond D. Hurd, c/o Fire, Weather & Avalanche Center, Island City, OR 97850, email: info@fireweatheravalanche.org
ABSTRACT
For decades, researchers have studied wildland fires and the variables that influence their behavior. In 1977, the National Fire-Danger Rating System (NFDRS) was introduced as a standardized system for assessing fire danger. In 1988, the Haines Index was developed for fire managers to assess atmospheric instability as it pertains to large or erratic wildfires. Numerous authors have concluded that fuels, terrain, and weather are primary factors influencing wildfire behavior and rate of spread. While the NFDRS and Haines Index are still commonly used, the Fire, Weather & Avalanche Center (FWAC) sought to develop a new wildfire growth potential model, for the organization's Wildfire Map website, based on three categories relevant to individual wildfires. The Fire Growth Potential (FGP) model predicts the likelihood of wildfire growth using meteorological variables in close proximity to the fire only. In designing the model, each category of wildfire growth likelihood is associated with the green-yellow-red scheme of colors to be easily identifiable among public users. Current and forecasted air temperature, relative humidity, and wind speed data near the location of a wildfire are combined for computation. A revision to the model was made in 2020 and subsequently this manuscript. Conclusions drawn from analysis of model data showed that the FGP model was successful in determining wildfire growth. Future revisions of the FGP model should include fuels and terrain to improve accuracy.
1. INTRODUCTION
Wildland fires cause billions of dollars in property damage and burn millions of acres of forests and grasslands each year. During the 20-year period of 2000-2020, wildland fires burned an average of 2.85 million hectares (7.043 million acres). Government agencies spent $1.64 billion to suppress these fires (National Interagency Fire Center 2020a; National Interagency Fire Center 2020b). For decades, meteorologists and wildland fire managers have studied wildfire behavior, the variables that influence them, and how to better predict their growth and prevent them from becoming large fires (Dennison et al. 2014; Gollner et al. 2015). In the 1970s, the National Fire-Danger Rating System (NFDRS) was developed to have one standardized system for assessing fire danger in the United States (Deeming et al. 1977; Bradshaw et al. 1984). In addition to the NFDRS, the Haines Index model was developed in the 1980s. Haines indicates the potential for large or erratic wildfires based on instability in the atmosphere. Fire managers use the model for decision-making purposes, such as staffing, foreseeing explosive fire behavior, and so forth. The Haines Index uses temperature and moisture at two atmospheric layers to determine stability (Haines 1988). Haines Index is still widely used in wildfire forecasting and monitoring (Winkler et al. 2007).
Though the NFDRS and Haines Index are reliable and commonly used, the Fire, Weather & Avalanche Center (FWAC) sought to develop a simple model for determining the likelihood of wildfire growth upon a fire's start. Often the general public is less experienced in understanding the Haines Index. FWAC developed the Fire Growth Potential (FGP) model seeking to provide a simple, ease-of-use tool for varying user groups to see the likelihood of a wildfire's growth. An increased concern about wildfire risk has led to the need to better understand factors affecting community preparedness as fires in the wildland-urban interface (WUI) have increased (Bihari and Ryan 2012; Bento-Gonçalves and Vieira 2020). Part of the FGP model goal is to assist individuals in better understanding a wildfire's growth potential as it relates to them and their community. By easily identifying growth potential based on color, individuals can make informed decisions. The FGP model was implemented, with revision, on the FWAC Wildfire Map in 2018. The FGP model was revised in 2020, and again in 2021, prompting an update to this manuscript.
2. BACKGROUND
In the United States, 98 percent of wildfires on state and federally managed lands are suppressed during initial attack operations (Houtman et al. 2013). Initial attack operations are aggressive actions by the first responding resources to contain and extinguish a fire. The remaining two percent of wildfires grow quickly to a large size by overwhelming initial attack resources, burning in poor fire weather conditions, and burning in fuel types that produce extreme fire behavior that exceeds firefighting capabilities, such as crowning and spotting (Finney 2005). Complex wildfires like the above-mentioned require the implementation of Type 1 or Type 2 Incident Management Teams (IMTs) "to provide a command and control infrastructure in order to manage the operational, logistical, informational, planning, fiscal, community, political, and safety issues associated with complex incidents" (National Interagency Fire Center 2021).
a. Current Models & Forecasts
The Haines Index is highly utilized in fire weather forecasts. The index is based on atmospheric stability and moisture content measuring the potential for wildfires to grow into large fires, but not actual fire starts (Winkler et al. 2007). Due to elevation variances in the United States, the Haines Index is derived for low elevations: 762-1458 m (2498-4781 ft) AGL, mid-elevations: 1458-3013 m (4781-9882 ft) AGL, and high elevations: 3013-5576 m (9882-18289 ft). These elevations are approximate as the actual index is computed in millibars for elevations in the atmosphere. Additionally, the Haines Index is based on current data or forecasted data, but not both.
Werth and Ochoa (1993) concluded that the Haines Index is best suited for plume-dominated fires with low winds. Substantially wind-driven fires, such as those influenced by the Santa Ana winds in Southern California, are not well-depicted by Haines. Meteorological data used to compute Haines Index comes from rawinsonde observations (RAOB) at 12:00 UTC and 00:00 UTC. As local weather conditions change, sometimes rapidly, Haines Index becomes obsolete by using up to 12-hour old data.
The U.S. Forest Service maintains the Wildland Fire Assessment System (WFAS) website (www.wfas.net) where several fire weather indices and models are posted publicly, including the NFDRS, Haines Index, Dry Lightning, Potential Lightning Ignition, and Lightning Efficiency. The NWS Storm Prediction Center (SPC) issues regular Fire Weather Outlooks on their website to highlight areas of elevated, critical, or extreme fire weather threats. Isolated and scattered dry thunderstorms are also highlighted. Each model has value and can aid in making complete and informed decisions. Further disadvantages with these models include output based on larger regions and not local geographical areas creating spatial variability uncertainties.
b. Wildfires Variables & Weather
Numerous authors have concluded three specific variables influence wildfire behavior in at least one way: fuel, weather, and terrain (Gollner et al. 2015; Rothermal 1972). Terrain includes the slope, aspect, elevation, and individualistic characteristics of topography in the area a wildfire is burning. Fuels are grouped into six categories, as defined by National Wildfire Coordinating Group (2020), that contain varying moisture amounts, soil moisture and temperature, availability—the fuel size class and shape and the ratio of outer surface area of a fuel exposed to the air in relation to non-exposed area, and time-lag—the rate at which dead fuel gains or loses moisture. Varying combinations of these variables can create extreme wildfire behavior, fire suppression difficulties, and increase the fire's rate of spread (ROS) (Tedim et al. 2018). Other human and environmental factors can change a fire's behavior and ROS.
Fuels and terrain are just equally important to weather for fire behavior. However, the FGP model and this article emphasize the use of weather variables in establishing a wildfire's potential growth. These important variables are air temperature, relative humidity, and wind speed as suggested in Werth and Ochoa (1993). The use of these variables was first described in Deeming et al. (1977). In the development of a Canadian fire weather index (FWI), Beverly and Wotton (2007) discussed the need to "provide daily and hourly ratings of fire susceptibility." All else equal, meteorological conditions within the immediate proximity of a wildfire remain the most important deterministic variables for how a fire evolves (Lindley et al. 2011). Based on this research, the FGP model focuses solely on weather as opposed to fuel and terrain.
Air temperature has multiple impacts on wildfire behavior and is argued to be the most important factor in determining potential wildfire behavior (National Wildfire Coordinating Group 2020). Requirements for ignition and continuous combustion are dependent on temperature. High temperatures created by solar radiation will dry fuels more rapidly and increase ROS. Peak temperatures are generally observed in the late afternoon as part of the diurnal cycle. Convective heat produced by the fire, combined with solar radiation heat, further dries fuels in advance of the fire and will increase ROS. The critical threshold for air temperature is considered to be 29.4 °C (85 °F), as defined by National Wildfire Coordinating Group (2020). Ongoing drought conditions can advance this process through already dry and cured fuels, easily susceptible to ignition and fire spread. Regardless of drought conditions, however, fire severity is a function of fuel load (Scasta et al. 2016).
Relative humidity is also argued to be the most important factor; however, relative humidity is derivative of temperature and has an inverse relationship with temperature—as temperature increases, relative humidity decreases; as temperature decreases, relative humidity increases. Relative humidity is defined as the ratio of the vapor pressure to the saturation vapor pressure with respect to water, typically expressed as a percentage (American Meteorological Society 2018). Higher relative humidities allow more heat to be absorbed by fuels before combustion while lower relative humidities have the opposite effect. Additionally, moisture will evaporate faster when relative humidity is low and can increase ROS. The critical threshold for relative humidity is considered to be 25 percent, as defined by National Wildfire Coordinating Group (2020).
Wind can create unpredictable and extreme wildfire behavior. Wind is the primary factor that influences a fire's ROS (National Wildfire Coordinating Group 2020). The velocity and direction of wind can change throughout the day. Atmospheric instability can contribute to additional unexpected wind conditions. Wind speed can advance the drying of fuels ahead of a fire and can physically move a fire in a specific direction due to pressure exertion. Convective winds, such as downdrafts, microbursts, and straight-line winds, can create additional complex wind conditions and further the complication of wildfire behavior prediction (Schroeder and Buck 1970). Meteorological phenomena such as lenticular clouds, cumulonimbus development, and suddenly calm conditions all indicate potentially dangerous changes in fire behavior. The critical threshold for surface wind speed is considered to be 4.47 m/s (10 mph), as defined by National Wildfire Coordinating Group (2020).
c. Design
In 2017, the FWAC website received nearly one million visitors on a proprietary interactive wildfire map that displays every wildfire reported to interagency dispatch centers. The map implements safety and strategy for the general public, firefighters, backcountry adventurers, and others (Sather and Hurd 2016). It is well known that wildfires affect forest recreation and its users (Englin et al. 2008). With the disadvantages of traditional fire weather indices, like Haines, FWAC sought to further its proprietary services by developing a new wildfire growth model.
Eastern Research Group (2014) found that colors and symbols should be used to convey threats. The general public is typically inexperienced or unfamiliar with fire weather indices and the input variables used. In designing the FGP model, FWAC chose to use green, yellow, and red colors that correspond to a specific likelihood of wildfire growth potential. The colors allow users to easily identify the potential (Tjan 2013). By limiting to three colors, users do not become overloaded with information (Figure 1). Mass et al. (2009) highlights the importance of having high-resolution probabilistic weather prediction in an accessible format; part of the goal being sought by FWAC.
Traditional fire weather indices are computed for large regions creating spatial variability concerns. The FGP model resolves this concern by computing the model in close proximity to a fire at the time it is requested by a website visitor or user. The model is not calculated in advance. "Close proximity," for the purposes of the model and this article is defined as 32.2 km (20 miles).
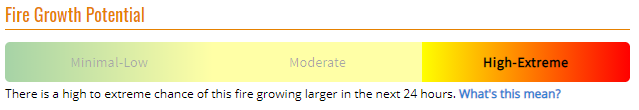
Figure 1: An example of the FGP model on the FWAC Wildfire Map website
3. METHODOLOGY
The nature of FWAC's Wildfire Map and FGP model precludes disclosure of the proprietary algorithm. However, the variables and methodology utilized in the algorithm are discussed. FWAC hypothesizes that a fire's growth is a direct result of changing weather conditions and the FGP model indicates that likelihood.
There is an emphasis on the importance of local meteorological conditions in proximity to a fire (Lindley et al. 2011; Erickson et al. 2016). The FGP model uses the meteorological variables temperature, relative humidity, and wind speed for computation. The model determines the nearest weather station to a wildfire from a group of more than 30,000 weather observation stations. The aforementioned variables are retrieved for use in the model.
To limit bias in the FGP model, FWAC utilizes weather forecast data from the NWS National Digital Forecast Database (NDFD). Hourly temperature, relative humidity, and wind speed variables are retrieved from the NDFD for the subsequent 24 hours from the time the model is calculated at a website visitor or user's request. The maximum temperature, minimum relative humidity, and maximum wind speed are then determined for the proceeding 24 hours.
From the derived data, the proprietary algorithm combines all meteorological variables to create a numerical index (Table 1). Each variable is weighted specifically based on influential importance to fire behavior. The numerical index ranges from zero to infinity and serves as statistical data for further research and determining the final scale for the FGP model. Based on the index value, the algorithm then determines the categorical growth potential risk and associated categorical color. Categorical growth potential risk is defined as the chance of a wildfire growing larger in the subsequent 24 hours if not controlled. Notwithstanding, the model does not imply exactly how large a wildfire could grow.
Table 1: FGP Model
| Color | Numerical Index | Likelihood |
|---|
| Green | <4 | Minimal to Low |
| Yellow | 4-6.99 | Moderate |
| Red | >=7 | High to Extreme |
In the event no wind speed data is available, the FGP model outputs a "null" value. If all meteorological data from weather stations or the NDFD is unavailable, the model also outputs a "null" value.
4. RESULTS
Because the FGP model is an ongoing project, results and statistics were taken at the time of this publication. A total of 181,706 models have been produced since the algorithm revision in 2020. However, only approximately 53 percent were non-null. This implies that no weather or wind speed data was available approximately half of the time the model was computed. To determine the effectiveness of the model, statistics were only calculated on wildfires that reported size. Other criteria for analysis required a fire did not grow or grew at least 0.04 ha (0.1 acres). Any fires that were smaller than initially reported were also not included (Table 2; Table 4; Table 5).
Table 2: FGP Categorical Occurrences
| Growth Potential | Occurrence |
|---|
| Minimal-Low | 37.56% |
| Moderate | 60.1% |
| High-Extreme | 2.34% |
Approximately 80.4 percent of fires fit the criteria defined previously. The change in size was determined by calculating the difference between the first and last model output. Outliers in the dataset were removed from analysis purposes only.
5. CONCLUSION
After reviewing previous FGP model results, FWAC concluded the model is mostly accurate in determining a wildfire's growth potential based solely on meteorological variables. On average, the moderate category had 8.459 times the fire growth over the minimal-low category. The high-extreme category had 2.726 times the fire growth over the moderate category and 23.059 times the fire growth over the minimal-low category.
However, the maximum acres a fire grew was larger in the moderate category than in the high-extreme category. Typically, data would be linear and the maximum fire size growth would be in the high-extreme category. Based on the standard deviations of the three categories, it is believed the numerical index used to assign a categorical name was not distributed properly. In June 2021, the numerical index distribution for categorical names was adjusted (Table 3) to compensate for the larger acres of growth in the moderate category and not the high-extreme category. Preliminary results are available for an 18-day period in June (Table 5; Figure 2). Initial analysis of the revised model yields a more representative distribution of the data.
Table 3: FGP Model (2021 revision)
| Color | Numerical Index | Likelihood |
|---|
| Green | <4 | Minimal to Low |
| Yellow | 4-5.99 | Moderate |
| Red | >=6 | High to Extreme |
While minor revisions to the FGP model have been positive, there is still a need to incorporate fuels and terrain into the computations because they largely contribute to wildfire behavior. Because those factors weren't included in the current version of the FGP model, the outliers removed from the dataset are likely attributable to fuels and terrain.
Based on these conclusions, FWAC believes the FGP model is a successful tool in describing a wildfire's growth potential accurately to website visitors and users and meets its intended goal. FWAC plans to continue revising the FGP model and incorporate fuels and terrain into future computations.
ACKNOWLEDGEMENTS
The Fire, Weather & Avalanche Center would like to acknowledge the following individuals for their previous contributions and review of this manuscript: Brian Sather, Eastern Oregon University; William "Billy" Reed, Jr., Harris Corporation; and Emily Hastings, U.S. Forest Service.
REFERENCES
American Meteorological Society, cited 2018a: Relative humidity. Glossary of Meteorology. [Available online at http://glossary.ametsoc.org/wiki/Relative_humidity].
Bento-Gonçalves, A., and A. Vieira, 2020: Wildfires in the wildland-urban interface: Key concepts and evaluation methodologies. Science of the Total Environment, 707: 135592.
Beverly, J. L., and B. M. Wotton, 2007: Modelling the probability of sustained flaming: predictive value of fire weather index components compared with observations of site weather and fuel moisture conditions. International Journal of Wildland Fire, 16: 161-173.
Bihari, M., and R. Ryan, 2012: Influence of social capital on community preparedness for wildfires. Landscape and Urban Planning, 106: 253-261.
Bradshaw, L. S., J. E. Deeming, R. E. Burgan, and J. D. Cohen, 1984: The 1978 National Fire Danger Rating System: Technical documentation. U.S. Department of Agriculture Forest Service General Technical Reports INT-169: 44. [Available online at https://www.weather.gov/media/hazardsimplification/Haz-Simp-Final%20-Focus-Group%20Report-Phase%20I-TO%20NOAA.pdf].
Englin, J., T. P. Holmes, and J. Lutz, 2008: Wildfire and the economic value of wilderness recreation. The Economics of Forest Disturbances, 191-208.
Erickson, M. J., J. J. Charney, and B. A Colle, 2016: Development of a fire weather index using meteorological observations within the northeast United States. Journal of Applied Meteorology and Climatology, 55: 389-402.
Finney, M. A, 2005. The challenge of quantitative risk analysis for wildland fire. Forest Ecology and Management, 211: 97-108.
Gollner, M., A. Trouve, I. Altintas, J. Block, D. Callafon, C. Clements, A. Cortes, E. Ellicott, J. B. Filippi, M. Finney, K. Ide, M. A. Jenkins, D. Jimenez, C. Lautenberger, J. Mandel, M. Rochoux, and A. Simeoni, 2015: Towards data-driven operational wildfire spread modeling. The Report of NSF-Funded WIFIRE Workshop, San Diego, CA. [Available online at http://cone.gollnerfire.com/wp-content/uploads/2015/09/WIFIRE_Wks_Report_FINAL.pdf].
Haines, D. A., 1988: A lower atmospheric severity index for wildland fire. National Weather Digest, 13: 23-27.
Lindley, T. T., J. D. Vitale, W. S. Burgett, and M-J. Beierle, 2011: Proximity meteorological observations for wind-driven grassland wildfire starts on the southern High Plains. Electronic Journal of Severe Storms Meteorology, 6: 1-27.
Mass, C., S. Joslyn, J. Pyle, P. Tewson, T. Gneiting, A. Raftery, J. Baars, J. M. Sloughter, D. Jones, and C. Fraley, 2009: PROBCAST: A web-based portal to mesoscale probabilistic forecasts. Bulletin of the American Meteorological Society, 90: 1009-1014.
National Interagency Fire Center, 2021: Incident Management Teams. [Available online at https://www.nifc.gov/resources/firefighters/incident-management-teams].
__, 2020a: National report of wildland fires and acres burned by state. [Available online at https://www.predictiveservices.nifc.gov/intelligence/2017_statssumm/fires_acres17.pdf].
__, 2020b: Federal Firefighting Costs (Suppression Only). [Available online at https://www.nifc.gov/fireInfo/fireInfo_documents/SuppCosts.pdf].
National Wildfire Coordinating Group, 2020: S-190 Introduction to Wildland Fire Behavior. [Available online at https://www.nwcg.gov/publications/training-courses/s-190].
Rothermel, R. C., 1972: A mathematical model for predicting fire spread in wildland fuels 1972. U.S. Department of Agriculture Forest Service Research Paper, INT-169: 40. [Available online at https://www.fs.fed.us/rm/pubs_int/int_rp115.pdf].
Sather, B. A., and T. D. Hurd, 2016: Online systems for integrating the safety, strategy, and stoke of backcountry adventure. International Snow Science Workshop, Breckenridge, CO. [Available online at https://arc.lib.montana.edu/snow-science/objects/ISSW16_P2.19.pdf].
Scasta, J. D., J. R. Weir, and M. C. Stambaugh, 2016: Droughts and wildfires in western US rangelands. Rangelands, 38: 197-203.
Schroeder, M. J., and C. C. Buck, 1970: Fire weather: A guide for application of meteorological information to forest fire control operations. U.S. Department of Agriculture Forest Service, Agriculture Handbook, 360.
Tjan, A. K., 2013: Make priorities clear with green, yellow, and red. Harvard Business Review. [Available online at https://hbr.org/2013/04/winning-with-green-yellow-and.html].
Werth, P., and R. Ochoa, 1993: The evaluation of Idaho wildfire growth using the Haines Index. Weather and Forecasting, 8: 223-234.
Winkler, J. A., B. Potter, D. Wilhelm, R. Shadbolt, X. Bian, and K. Piromsopa, 2007: A climatology of the Haines Index for North America derived from NCEP/NCAR reanalysis fields. International Journal of Wildland Fire, 16: 139-152.
APPENDIX

Figure 2: FGP Model Values for Starting and Ending Acreage
Table 4: FGP Results for Fire Growth (2020 revision)
| FGP Observations | Fire Growth |
|---|
| Category | No. of Obs | Pct. of All Obs | Average | Max | Std. Deviation |
|---|
| Minimal-Low | 1821 | 37.53% | 1.04 ha
(2.57 acres) | 312.42 ha
(772 acres) | 34.08 |
| Moderate | 2918 | 60.14% | 10.92 ha
(26.99 acres) | 312.42 ha
(6670 acres) | 293.51 |
| High-Extreme | 113 | 2.33% | 22.29 ha
(55.07 acres) | 312.42 ha
(3600 acres) | 380.24 |
Table 5: FGP Results for Fire Growth (June 2021 revision)
| FGP Observations | Fire Growth |
|---|
| Category | No. of Obs | Pct. of All Obs | Average | Max | Std. Deviation |
|---|
| Minimal-Low | 823 | 30.53% | 4.27 ha
(10.57 acres) | 1446.75 ha
(3575 acres) | 171.12 |
| Moderate | 1233 | 45.73% | 43.71 ha
(108.01 acres) | 10,658.61 ha
(26,338 acres) | 1112.3 |
| High-Extreme | 640 | 23.74% | 81.57 ha
(201.57 acres) | 11,169.73 ha
(27,601 acres) | 1705.33 |